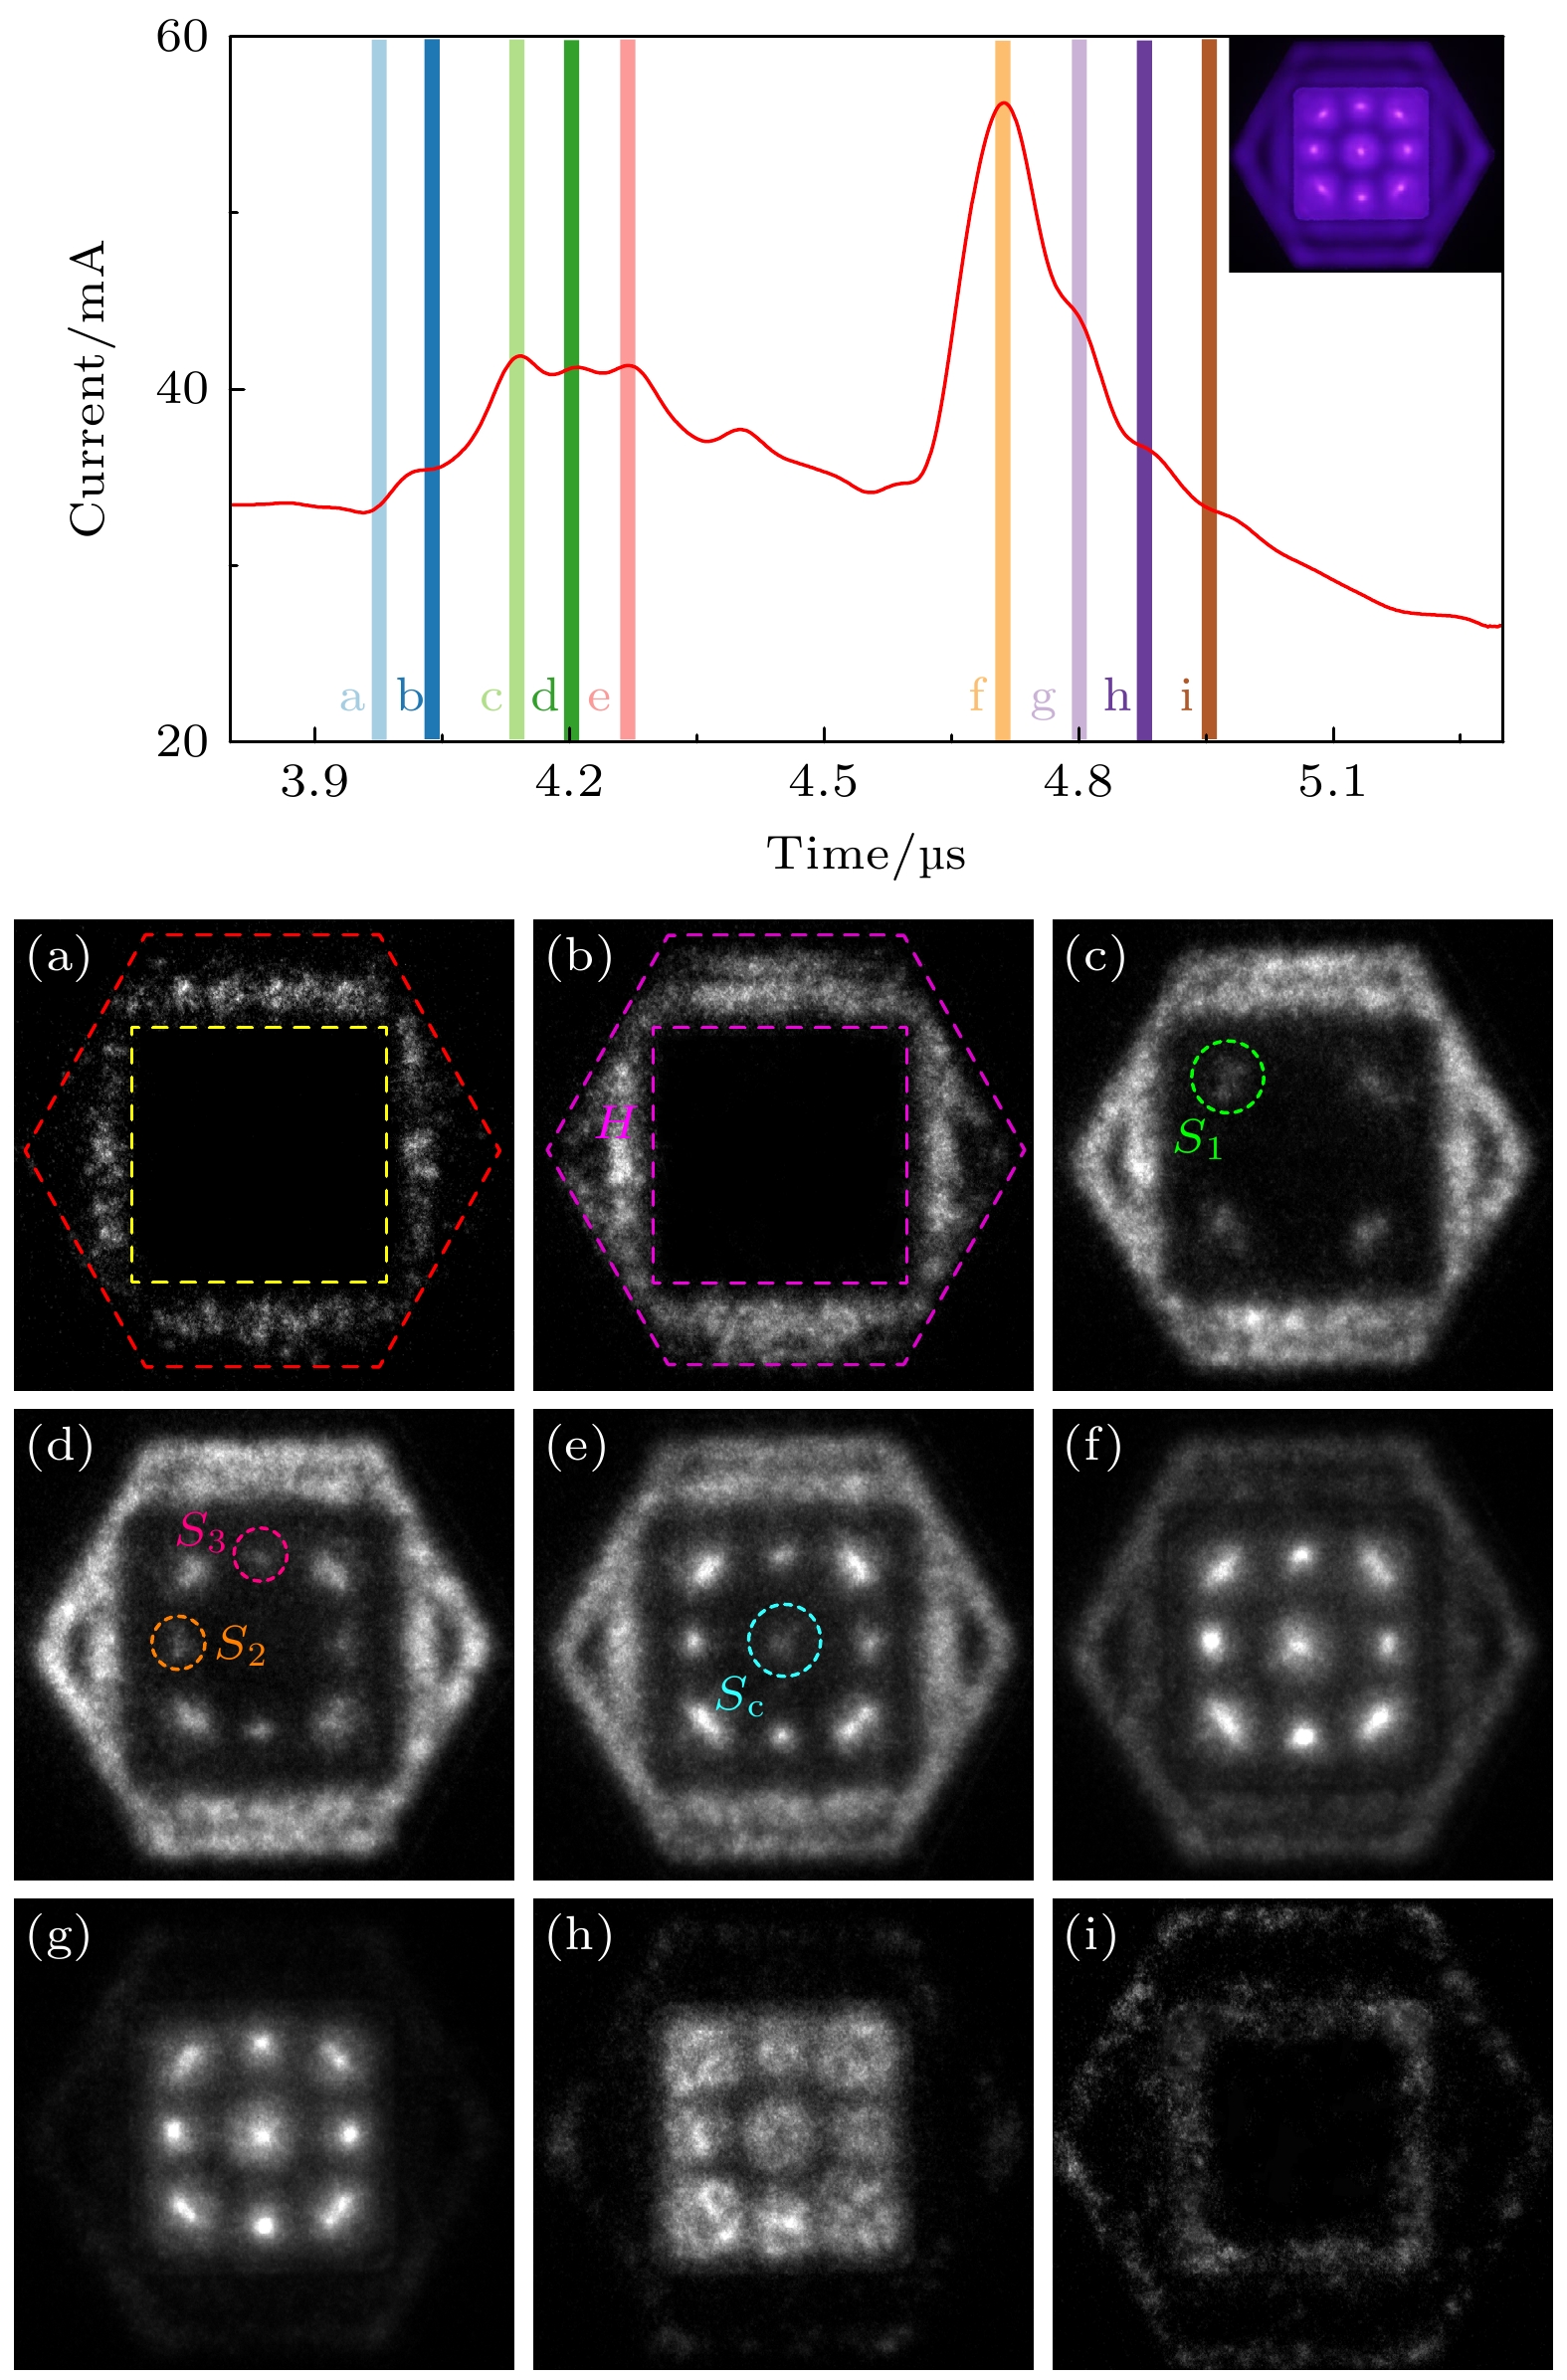
Pattern discharge is a common mode in dielectric barrier discharge (DBD) and has broad application prospects in various industrial fields, such as material surface treatment, environmental monitoring, and biomedical applications. In this work, a mixed gas of 75% argon and 25% air is used to generate a pattern discharge. A double-gap boundary composed of hexagonal configuration and square configuration is employed, and the gas pressure is fixed at 20 kPa. By varying the applied voltage amplitude, single-ring pattern, square-point-line pattern, square lattice pattern, and annular-lattice pattern are obtained for the first time. The discharge characteristics and their temporal correlation are studied using both optical method and electrical method. The results show that the discharge patterns exhibit multiple discharges in each half of the voltage cycle, and these discharges are temporally correlated with each other. Time-resolved discharge images of the square lattice pattern are captured using an enhanced charge-coupled device (ICCD). The experimental results reveal that multiple discharges in a half-voltage cycle correspond to the ignition process of the pattern in the radial direction from the outside to the inside. The morphology of the square lattice pattern observed by the naked eye is actually the result of the temporal superposition of luminescence from points at different positions in the evolution process. The formation mechanism of this pattern is analyzed through electric field simulations and theoretical calculations. Plasma parameters are diagnosed by collecting the emission spectrum of the square dot-lattice pattern. The results show that the electron density gradually decreases radially from the outer region to the inner region, while the electron temperature and molecular vibrational temperature increase radially from the outer region to the inner region, and the molecular rotational temperature remains almost unchanged. The temporal evolution of the square lattice pattern is shown in the following figures, where the current waveform marks the timing of each frame of ICCD imaging for the complete square lattice pattern:


 下载:
下载:


